How to Use a Google Workspace Gantt Chart?
The popularity of the Workspace suite of tools from Google has led to many teams using it to boost their productivity. Yet, one of the key questions often asked is how they can use a Google Workspace Gantt chart to boost their efficiency further.
Why Do You Need a Google Workspace Gantt Chart?
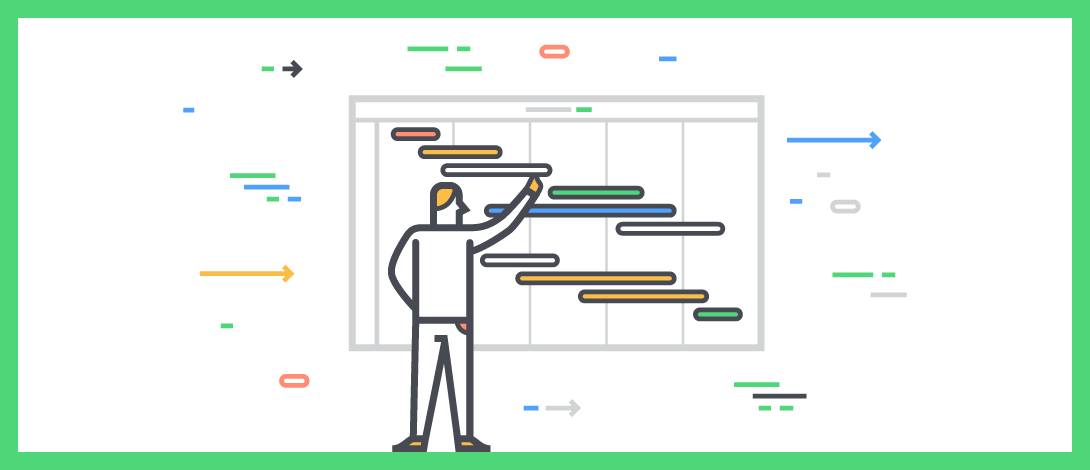
A Gantt chart is a visual representation of a plan and the individual tasks that make it up. This sort of chart is to plan the resources and schedule tasks to ensure that everything runs as smoothly as possible. The clear, simple design makes it easy to use and also to understand at a glance.

Gantt charts are present around the planet for planning purposes. They can be hugely beneficial in helping to avoid issues such as missed tasks or two people carrying out the same task. One area where it’s particularly good is in helping you to link related tasks. So, their dependency is clear from the start.
Is There Gantt Provided by Google?
While this method of project planning is extremely popular, Google hasn’t added one to their online productivity suite. This makes it difficult for teams who want all of the benefits of Workspace but need to carry on with the Gantt approach to manage their tasks in the way they’re used to.
The idea of going outside Workspace to plan and track projects isn’t appealing. This means losing some of the benefits of using it in the first place.
Thankfully, the Kanbanchi tool provides an ideal solution, as it’s seamlessly integrated with Workspace. This makes it the best option when your team is looking for a Google Workspace Gantt chart. It meets their needs and allows them to work together more productively.
Read all articles connected with Google Workspace here
